GoNL-WGS-SNV-discovery-F1.png
From ISOGG Wiki
No higher resolution available.
GoNL-WGS-SNV-discovery-F1.png (454 × 455 pixels, file size: 35 KB, MIME type: image/png)
Summary
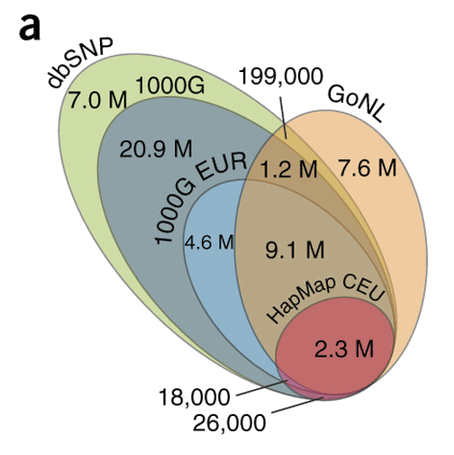
Francioli, Menelaou et al 2014 Figure 1: Discovery of SNVs and structural variation. (a) Venn diagram of all SNVs discovered in GoNL relative to dbSNP (Build 137) and the 1000 Genomes Project (1000G) Phase 1 and HapMap CEU panels. The majority of the 7.6 million novel sites are rare (MAF < 0.5%), including 5.8 million singletons. Francioli et al 2014 doi:10.1038/ng.3021
Licensing
| This file is licensed under the Creative Commons Attribution ShareAlike 3.0 License |
File history
Click on a date/time to view the file as it appeared at that time.
| Date/Time | Thumbnail | Dimensions | User | Comment | |
|---|---|---|---|---|---|
| current | 17:04, 27 November 2015 | | 454 × 455 (35 KB) | ChrisR (talk | contribs) | Figure 1: Discovery of SNVs and structural variation. (a) Venn diagram of all SNVs discovered in GoNL relative to dbSNP (Build 137) and the 1000 Genomes Project (1000G) Phase 1 and HapMap CEU panels. The majority of the 7.6 million novel sites are rare... |
- You cannot overwrite this file.
File usage
The following 2 pages link to this file: